The 2011 Threshold Evaluation Report was issued in October 2012. This is the fifth comprehensive report since the Regional Plan was adopted in 1987.
An independent panel of scientists coordinated by the Tahoe Science Consortium reviewed the 2011 Report and found it to be technically sound. The peer review stated the 2011 Threshold Evaluation represents a significant improvement over previously published reports. The panel commended TRPA for using a more transparent process to determine threshold attainment status at the standard level.
The 2011 Threshold Evaluation addressed 151 environmental standards and made a status determination on 92 of these standards. Of these, 62 percent were attained or implemented and 38 percent have not yet been attained.
Please visit the links below to explore the 2011 Threshold Evaluation Report contents.
Executive Summary
Errata Sheet
Table of Contents
1 Introduction
2 Methodology
3 Air Quality
4 Water Quality
5 Soil Conservation
6 Vegetation
7 Fisheries
8 Wildlife
9 Scenic
10 Noise
11 Recreation
12 Implementation
13 Conclusions
14 References
List of Figures
List of Tables
Acknowledgements
Appendices
A Socioeconomics
B Resolution 82-11
C Threshold Attainment Status Crosswalk
D Peer Review
E Response to Peer Review Table
WQ-1 Stream Concentrations
WQ-2 Sediment Nutrient Load
WQ-3 Flow Weighted Concentrations
IE-1 Compliance Measures
IE-2 Stream Conceptual Model
IE3- Stormwater Management/BMP Retrofit Program
IE-4 AIS Program Summary
IE-5 2011 Science Summary
CR-1 Fertilizer White Paper
CR-2 Threshold Updates
THRESHOLD CATEGORY REPORTING CATEGORY INDICATOR |
---|
THRESHOLD CATEGORY REPORTING CATEGORY INDICATOR |
---|
THRESHOLD CATEGORY REPORTING CATEGORY INDICATOR |
---|
THRESHOLD CATEGORY REPORTING CATEGORY INDICATOR |
---|
THRESHOLD CATEGORY REPORTING CATEGORY INDICATOR |
---|
THRESHOLD CATEGORY REPORTING CATEGORY INDICATOR |
---|
THRESHOLD CATEGORY REPORTING CATEGORY INDICATOR |
---|
THRESHOLD CATEGORY REPORTING CATEGORY INDICATOR |
---|
THRESHOLD CATEGORY REPORTING CATEGORY INDICATOR |
---|
THRESHOLD CATEGORY REPORTING CATEGORY INDICATOR |
---|
THRESHOLD CATEGORY REPORTING CATEGORY INDICATOR |
---|
The threshold evaluation assigns a status to an indicator relative to the adopted standard. As shown on the icon legend below, the background color of the reporting icon communicates the indicator “status” or estimate of current condition. For numerical standards, the status of an indicator is classified into “better” or “worse” categories based on the percent divergence of the current indicator value from the standard or interim target. For most indicators, the current value is taken directly from the value recorded in the most recent year. In some cases, the average value calculated from all data collected during the evaluation period is used. When an average value is used, it is noted and explained on the indicator evaluation page for that specific evaluation year.
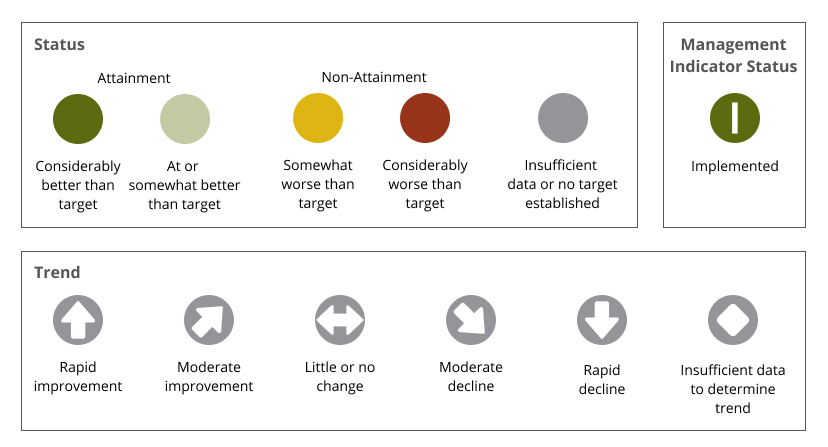
Note: Thresholds reported as "Implemented" refer to thresholds that were adopted as policy guidance in the development of the Regional Plan. In these cases, the subject policies, ordinances, or environmental protections have been incorporated into the TRPA Regional Plan and TRPA Code of Ordinances.