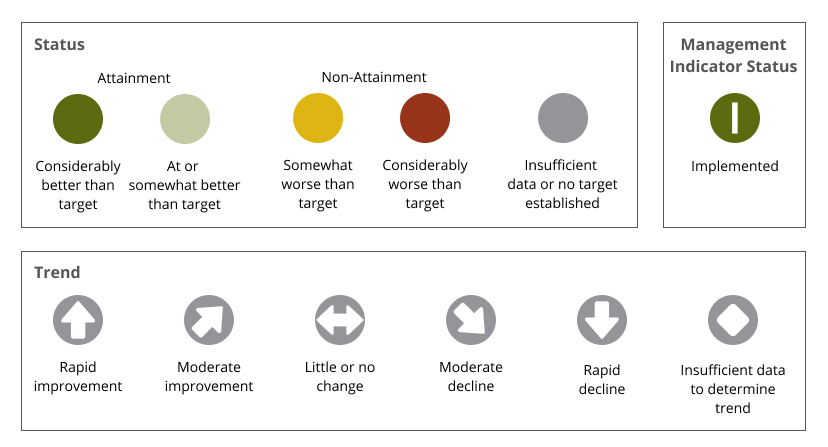
The threshold evaluation assigns a status to an indicator relative to the adopted standard. As shown on the icon legend below, the background color of the reporting icon communicates the indicator “status” or estimate of current condition. For numerical standards, the status of an indicator is classified into “better” or “worse” categories based on the percent divergence of the current indicator value from the standard or interim target. For most indicators, the current value is taken directly from the value recorded in the most recent year. In some cases, the average value calculated from all data collected during the evaluation period is used. When an average value is used, it is noted and explained on the indicator evaluation page for that specific evaluation year.


Note: Thresholds reported as "Implemented" refer to thresholds that were adopted as policy guidance in the development of the Regional Plan. In these cases, the subject policies, ordinances, or environmental protections have been incorporated into the TRPA Regional Plan and TRPA Code of Ordinances.